Serving the Flathead Valley & Montana since 2006. A reality based independent journal of observation & analysis. © James Conner.
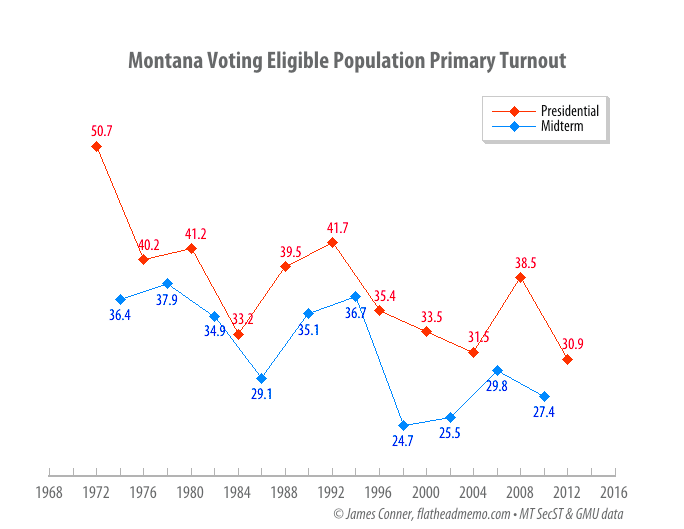
The graph below uses the Voting Eligible Population statistic, which is the voting age population (18+) minus persons not legally qualified to vote, usually foreign nationals, imprisoned felons, and the legally insane. If you’d like to run the numbers yourself, here’s the spreadsheet.