
22 August 2020 — 1525 mdt
The pre-convention polling picture
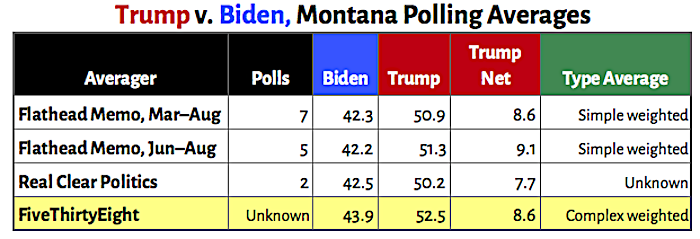
Biden leads Trump by 8.7 point nationwide —
but in Montana, Trump leads Biden by ≈ 9 points
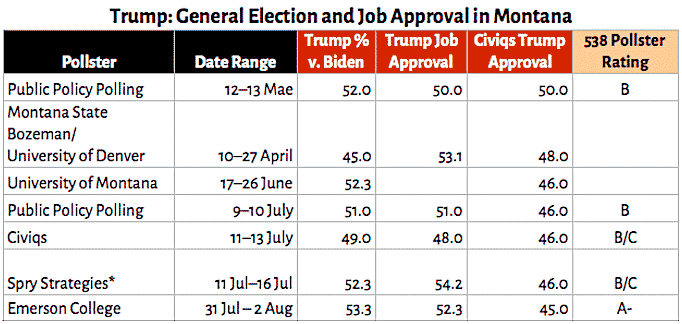
President Trump’s net job favorability rating is 11–12 points underwater on a national scale, but he’s still above the waterline in Montana. And largely because of that, going into the national Democratic and Republican conventions he was leading Joe Biden in Montana by almost nine points according to seven publicly available polls of Montana.
An abbreviated discussion of the polls follows these plots of the horserace and job approval polls. The Spry poll, incidentally, is a publicly released poll conducted for a partisan, probably a conservative partisan.

FiveThirtyEight and RealClearPolitics have calculated the average of Trump’s lead over Biden. FiveThirtyEight’s average is weighted by several factors, sophisticated; it sets the standard for everyone elese. RealClearPolitics’ average appears to be a simple average of the percents, not a good practice. Flathead Memo calculated simple weighted means that give too much influence to older polls.
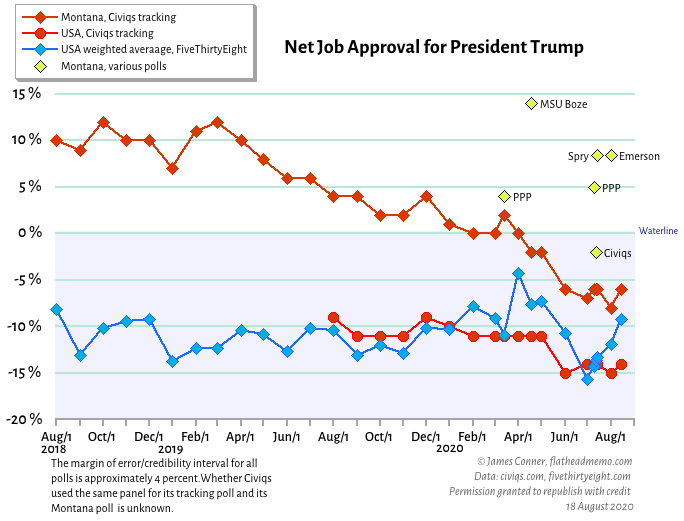
Notice how much Civiqs’ Trump approval rating for Montana differs from the other Montana polls. Civics’ national Trump approval rating, however, is fairly close to FiveThirtyEight’s weighted average. Much as I like Civiqs’ Trump approval numbers, I think they markedly underestimate Trump’s popularity in Montana.
Discussion
Post-convention polls may report different results. The polls examined here were conducted before Joe Biden tapped Kamala Harris as his running mate. We don’t yet know whether her presence on the ticket help or hurt Biden. She’s likable, always a plus. She’s of mixed race, not white, not always a plus in Montana, although Barack Obama did well here in 2008, losing to Sarah Palin burdened John McCain by less than three points, 47.3 to 49.5. In 2012, with Paul Ryan as his running mate, Mitt Romney beat Obama by 13.7 points, 55.4 to 41.7 percent. If Harris is a negative for Biden in Montana, she’ll probably be a negative primarily because she’s a woman, not because she’s a person of color. And whether she helps or hurts, it probably won’t be by much.
Worry time in Donkeyland. These polls show Democrats Steve Bullock, Mike Cooney, and Kathleen Williams, trailing their Republican opponents, Steve Daines, Greg Gianforte, and Matt Rosendale, who are hugging Trump more closely than their wives, by several points. These Democrats are in trouble. Overtaking their opponents will remain a formidable challenge as long as Trump stays above the 50 percent mark. I’ll examine these races in the coming days.
These are not the only polls of Montana’s four most important statewide elections. Candidates with multi-million-dollar budgets poll frequently, but seldom release the results lest they provide the opposition with useful information. When campaigns do release polls reporting their candidate is leading, they do so to counter a public poll showing the opposition leading the race, to boost small dollar fundraising, and to boost the morale of the campaign’s staff and volunteers.
When public polls report Smith is leading Jones, and Jones does not release a poll reporting he’s leading Smith, you can bet that Jones’ polls report Smith is leading. If Jones trashes a public poll reporting Smith is leading, the trashing usually confirms the public poll got it right.
Third parties — usually the megadollar PACs — also poll frequently. And sometimes individuals spend a hundred bucks or so for private online polls conducted by Google and others. In 2017, for example, I located three private Google consumer polls, sample sizes of 300 or so — of the Gianforte-Quist election. All were wildly off the mark.
Avoid the statistical tie trope. Two candidates are tied if, and only if, their percentages are identical.
What we really want to know is the probability that one candidate is leading the other. If Candidate A’s lead over Candidate B is greater than twice the MOE/CI, there is a high probability (usually 95+ percent) that “A” is leading. If the difference between the candidates is less than twice the MOE/CI, if it’s within the MOE/CI, the probability of a ballot lead can be calculated. The American Research Group provides an online ballot lead calculator.
In highly competitive elections, polling results are almost always within the MOE/CI, which is why the probability of a ballot lead is such an important statistic.
All reputable pollsters try to get it right, but not all polls are equal. All polls have what FiveThirtyEight’s Nate Silver calls house effects, the biasing in one direction that’s a consequence of how the polls were conducted. Rasmussen, notorious for its robo calls, consistently leans Republican by a few points. Public Policy Polling, employed by liberal causes, is thought to have a slight bias toward Democrats. Over time, the house effect can be identified, quantified, and minimized by applying a correction to the poll’s results. Averaging polls may also reduce the impact of house effects.
The MOE/CI is not the only source of uncertainty in polls. MOE/CI is a standard statistic that quantifies uncertainty as a function of a poll’s sample size. How the questions are phrased and how the results are weighted so that the sample’s demographics more closely approximate the demographics of the voting population also produce uncertainty. In Montana, the MSU-Bozeman poll has a more sophisticated weighting scheme than does the University of Montana’s Big Sky Poll, which weights only for gender, geography, and education. As a general principle, better funded and more experienced and skilled pollsters do better jobs of weighting samples.
As the polls predicted, Hillary Clinton won the popular vote in 2016. Remember that. The problem in polling was at the state level. FiveThirtyEight’s Nate Silver tells the story:
You read that right. Polls of the November 2016 presidential election were about as accurate as polls of presidential elections have been on average since 1972. And polls of gubernatorial and congressional elections in 2016 were about as accurate, on average, as polls of those races since 1998. Furthermore, polls of elections since 2016 — meaning, the 2017 gubernatorial elections and the various special elections to Congress this year and last year — have been slightly more accurate than average. This isn’t just a U.S. phenomenon: Despite often inaccurate and innumerate criticism over how polling fared in events like Brexit, a recent, comprehensive study of polling accuracy by Professor Will Jennings of the University of Southampton and Professor Christopher Wlezien of the University of Texas at Austin found polling accuracy has been fairly consistent over the past several decades in a variety of democratic countries in Europe, Asia and the Americas.
The media narrative that polling accuracy has taken a nosedive is mostly bullshit, in other words. Polls were never as good as the media assumed they were before 2016 — and they aren’t nearly as bad as the media seems to assume they are now. In reality, not that much has changed.
That’s not to say there aren’t reasons for concern. National polls were pretty good in the 2016 presidential election, but state-level polling was fairly poor (although still within the “normal” range of accuracy). Polls of the 2016 presidential primaries were sometimes way off the mark. And in many recent elections, the polls were statistically biased in one direction or another — there was a statistical bias toward Democrats in 2016, for instance.
There’s also reason to worry about what’s going into the polls as response rates to polls decline and as newsrooms cut their budgets for traditional, high-quality surveys. Internet-based polling may eventually be a part of the solution, but for the most part,1 it was quite inaccurate in 2016 (we’ll go into more detail on this point in another article later this week). Let’s dig further into the evidence:
We need more publicly available polls in Montana. I believe the most promising publicly available polling in Montana is Montana State University’s, behind which the driving force is political science professor David Parker. At this point, that’s the operation that gives the best bang for the dollar, and where I would put my money.
Most online polls on websites are garbage. They’re not scientifically designed sampling operations. Instead, they’re gimmicks to boost readership. Ignore them.